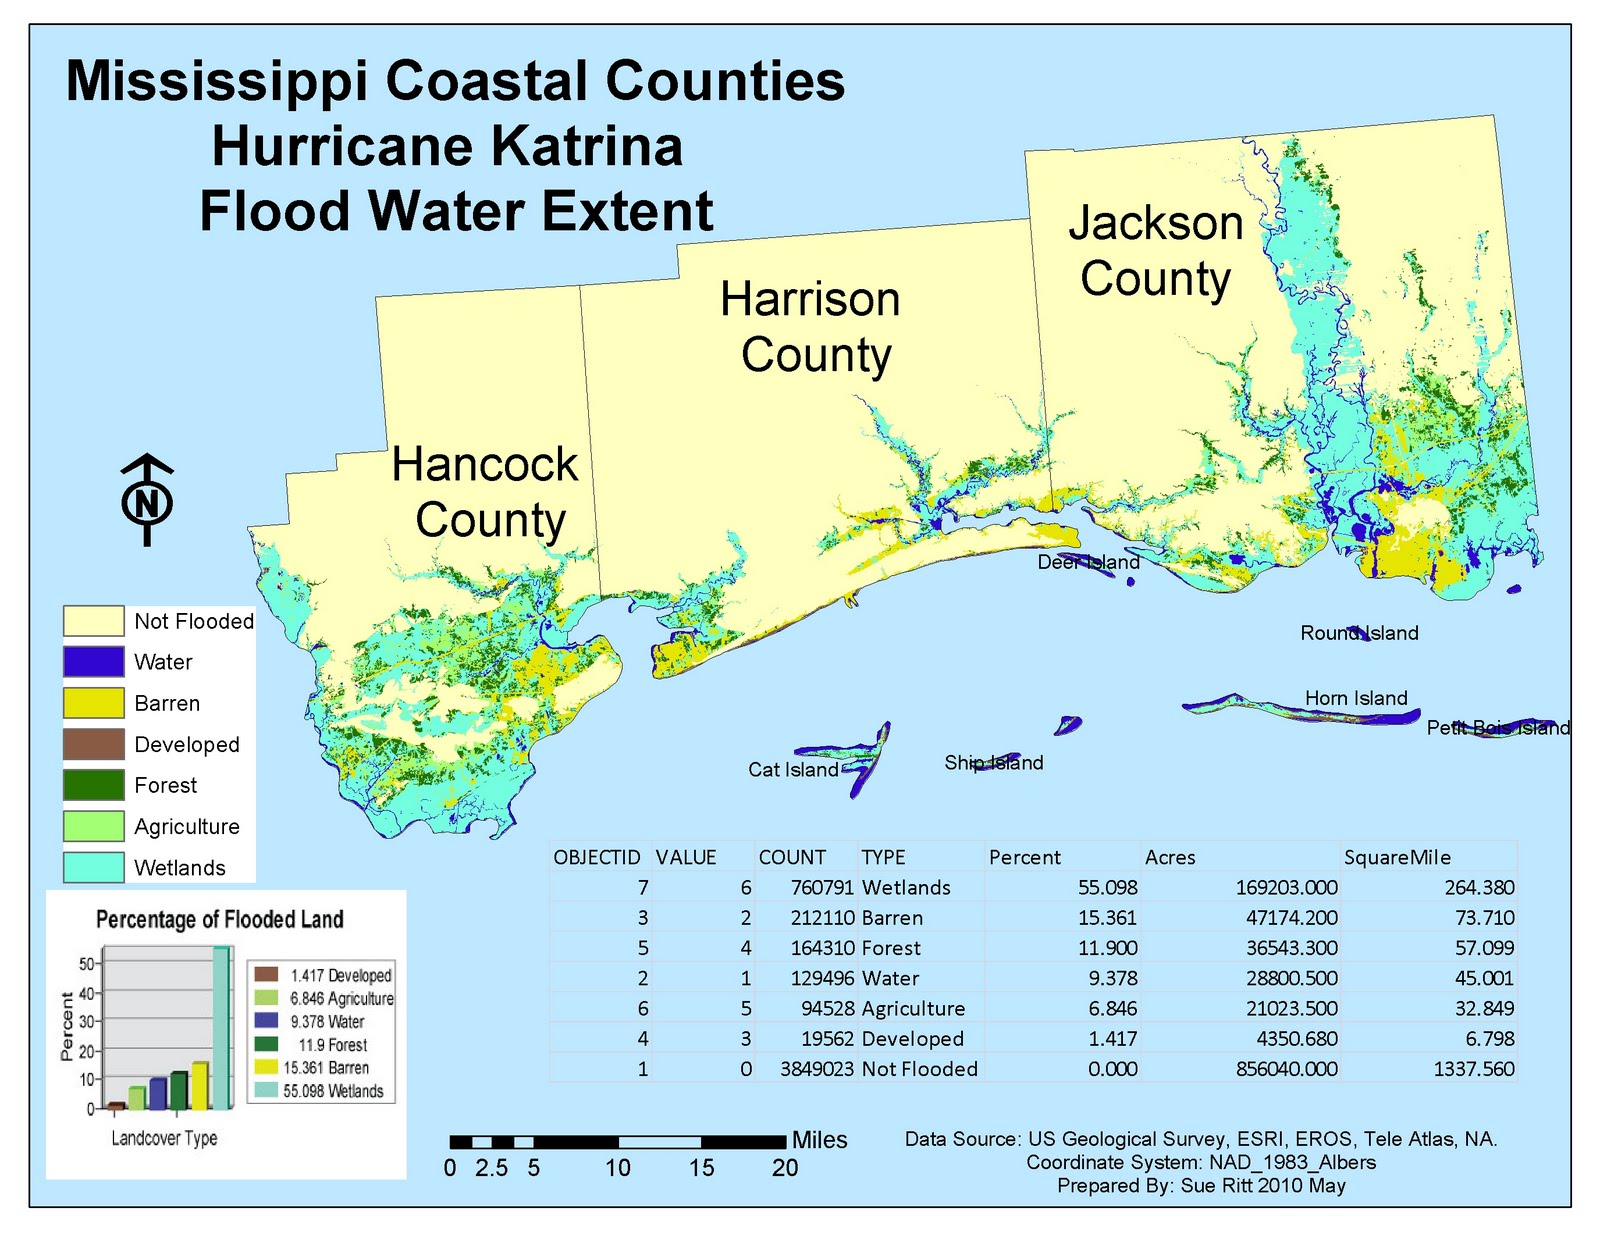
The Mississippi Coastal Counties Hurricane Katrina Flood Water Extent Map was made for the University of West Florida's Applications in GIS class project for Unit 3: Hurricane Analysis. Students are required to present a layout view map showing elevation, hydrography, and Bathymetry of the Mississippi Coast counties with places, types of water, barrier islands, and hydrography. We were then required to submit a graph detailing flooded areas by land cover type.
Taking our map one step further we added the US Geological Survey land cover map and reclassified land cover types into 7 catagories.
Problem:
The catagories listed in Step 5 substep 4: 0 not flooded; 1 water; 2 barren; 3 developed; 4 forest; 5 agriculture; 6 wetlands; DO NOT MATCH the catagories provided in previous step 3 reclassifity land cover substep 3. As a result, I think the map is an inaccurate assessment of flooded lands. Given I followed the instructions precicely and I do not have the time to fix the error, I am moving on.