07 August 2010

Applications in GIS Final Project


Click here for the slide show:

http://students.uwf.edu/sr31/FINAL_PDF.pdf


and here for the slide by slide write up:

http://students.uwf.edu/sr31/FINAL_PDF2.pdf

Please let me know what you think...

18 July 2010

07.17.10 Deliverables Homeland Security

http://students.uwf.edu/sr31/U9_SRITT.pdf

Sometimes you feel like a nut, sometimes you don't!

Sometimes blogger links, other times it doesn't...please cut and paste above link.

UWF's Applications in GIS Unit 9 lesson plan centered on data management. We were to learn new methods or ways to organize your data for large projects and data sets. With all the problems I had with drive space this week, I lost focus and really did not come away with any new insight on data organization. I hope to complete lesson 10 and the Remote Sensing deliverable with enough time to review it again. (Ha--just like that reserving space last month Sue -- there is just never enough time in a day...)

I did learn that GIS in the real world will involve data sets and files that are computer resource hogs....patience and perseverance are key! A two computer system is very helpful and the ability to multi-task while you wait, essential.

I am very excited about the exercise this week. This area of Colorado is more like my own backyard (well not NORAD) than Florida where I currently live. I spent many years living in Colorado Springs and also a small mining community just on the western edges of our boundary area in Teller County. I worked all over of area of interest...in the cities, on the top of Pikes Peak and in little communities in the middle of nowhere.

I recently purchased copies and originals of several hand drawn and historical maps of the Cripple Creek and Victor Gold Mining District. Pretty cool stuff! There is a catacomb of gold mining tunnels (now managed by the CC/V Gold Mining Company) that span the distance between the two towns and who knows how far under the Front Range (toward Pikes Peak and Cheyenne Mountain).

One of the best maps I have ever seen is located in the Cripple Creek Museum. The map is enclosed in a glass box and raised up on a platform. You walk up several steps to view into the map from the top. Here you see a classic 2D map layout with different points showing the location of the mine entrances and camps or lines for trails and railroad. When you step back down you look into the map from the sides to see the different layers and levels of tunnels than run miles and miles deep into the Earth. Like I said, pretty cool stuff! I aspire to digitize, add attribute data and document the maps I purchased into a GIS to produce an historical overview of the mining activities of the area. Maybe someday I can compare them to the one at the museum. Yeah, Sue dreams BIG!

06 July 2010

07.08.10 Deliverables Crime Analysis

See the pdf here:

http://students.uwf.edu/sr31/U8.pdf


or the powerpoint presentation here:

http://students.uwf.edu/sr31/U8.ppsx


06.30.10 Deliverables Location Analysis

For reasons beyond my control, I cannot post a link that you can click on to get to my presentation. I have tried in both IE and Mozilla and on the TS without success. If you are interested in viewing my "On Your Own Site Location Analysis", please cut and paste this link:

http://students.uwf.edu/sr31/OWN SITE.ppt


Palm Beach County Site Analysis by Sue Ritt

Palm Beach County is the largest county in the state of Florida in area. As of 2008, the rapidly-growing county's estimated population was 1,294,654. Palm Beach County borders Martin County to the North, the Atlantic Ocean to the East, Broward County to the South, Hendry County to the West, and extends into Lake Okeechobee in the Northwest, where it borders Okeechobee County and Glades County at one point in the center of the lake.

With wealthy coastal towns such as Palm Beach, Jupiter, Manalapan, and Boca Raton within its limits, as well as equestrian mecca Wellington and golfing haven Palm Beach Gardens, Palm Beach County is Florida's wealthiest county, with a per capita personal income of $44,518 as of 2004.

Mr. and Mrs. Smith, an affluent, established professional couple are relocating to Palm Beach County (PBC) and wish to purchase a new home in an upscale area that has a high percentage of children under the age of 18 and is also close to both their jobs. He will be teaching classes at Florida Atlantic University and she will be practicing medicine at West Boca Medical Center.

Deliverables:
1. Base map showing places, roads, and public lands.
2. One map showing:
a. Distance from Florida Atlantic University (FAU).
b. Distance from West Boca Medical Center (WBMC).
c. Census tracts showing percentage under 18
d. Census tracts showing median home values
3. A map, with analysis, showing the weighted overlays based on the client’s criteria.


Data layers needed:

All files downloaded from Florida Geographic Data Library at http://www.fgdl.org.

Projected Coordinate System: Albers Conical Equal Area
Geographic Coordinate System: GCS_NorthAmerican_HARN_1983

 Roads – vector
 Public lands – vector
 Hospitals – vector
 Colleges and Universities – vector
 Cities – vector
 County boundary – vector
 County demographics – database file
 Census tracts 2000 – vector and database file


Process Documentation:
1. Add county boundary layers >select and export PBC as layer to use a base for future clips.
2. In ArcCatalog clipped all files to PBC_ctnbnd.
3. Create Location geodatabase > imported multiple files > set coordinate system to same as display, extent to PBC_ctnbnd, raster 300, mask to PBC-ctnbnd.
4. Create results geodatabase.
5. Open ArcMap > Document map and set environments
6. Create base map of PBC.
7. Calculate distance from FAU
8. Calculate distance from WBMC
9. Create field for percentage
10. Create median house values.
11. Create weighted overlay with each factor weighted at 25%
12. Analysis of results and presentation.

References

Photo credits:

http://www.dreamhomedesignusa.com/images/Photoshop%20Images/Exotic_Mediterranean_red.jpg
http://www.surfline.com/travel/surfmaps/us/florida_south/images/warnke_redreefpark.jpg
http://upload.wikimedia.org/wikipedia/en/b/bd/Palm_Beach_County_Seal.png

Palm Beach County Data Captions (2010). Wikipedia. Retrieved June 30, 2010 from http://en.wikipedia.org/wiki/Palm_Beach_County,_Florida.

Data Layers (2010). Florida Geographic Data Library. Retrieved June 30, 2010 from http://www.fgdl.org.

06.23.10 Deliverables Location Analysis

reserving space I will catch up here soon...

06 June 2010

06.09.10 Deliverable #2

The first of three submissions analyzing the impact of the Deep Horizon Oil Spill in the Gulf of Mexico in the Fort Barrancas, Florida area (ESI Map Index Tile 5).


Sean's gracious comment below refers to an earlier map I posted to test the view of my topo layer.

05 June 2010

06.09.10 Deliverable #1

This map was created as part of UWF's Applications in GIS class Unit 4 class project deliverable one: Deep Horizon Oil Spill; Fishing Closure Boundaries. Longitude and Latitude coordinates were obtained from existing NOAA maps, input into excel and imported into ArcMap. We created a new polygon shapefile, started an editing session to create the boundary layer from the imported point file and then exported the boundary file as a kml file. My first go round my kml file put me on the NW corner of the Galapagos Island. Upon reopening the mxd file, I noticed one of my coordinates was along the equator. I deleted the files and started over.


01 June 2010

06.02.10 Deliverable #5

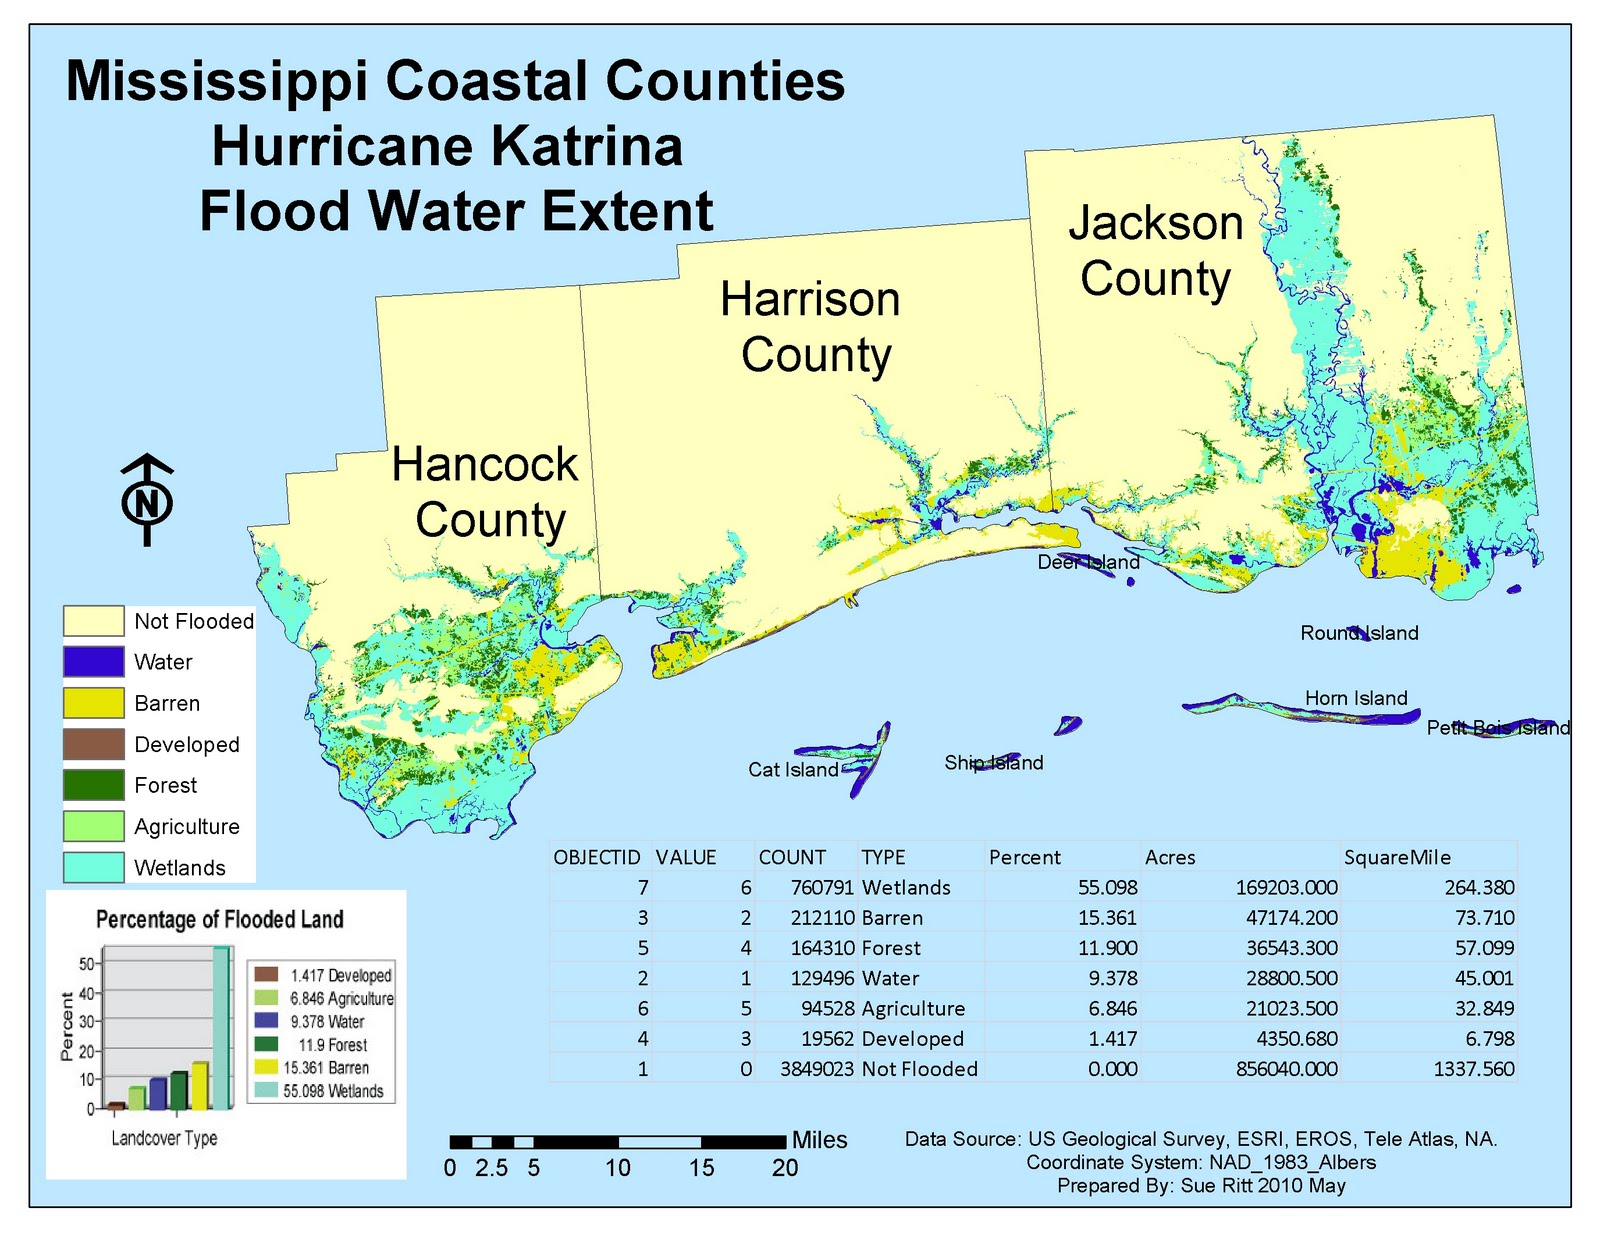
The Mississippi Coastal Counties Hurricane Katrina Flood Water Extent Map was made for the University of West Florida's Applications in GIS class project for Unit 3: Hurricane Analysis. Initially students were required to present a layout view map showing elevation, hydrography, and Bathymetry of the Mississippi Coast counties with places, types of water, barrier islands, and hydrography. By adding the US Geological Survey land cover file and reclassifing land cover types into 7 catagories, students were then directed to submit a graph detailing flooded areas by land cover type. Finally, we were asked to create a table detailing the land cover types affected by the storm surge expressed as a percentage, by acreage totals per land type and by square miles.


06.02.10 Deliverable #4

The Coastal Mississippi Counties Hurricane Katrina Infrastructure Damage Assessment Map was created as the fourth deliverable for UWF's Applications in GIS class project Unit 3: Hurricane Analysis. The map details the roads, hospitals and churches most likely to be flooded from Hurricane Katrina's storm surge.

Central southern Harrison county should experience the least amount of flooding with southwest Hancock and eastern Jackson as the hardest hit areas. Singing River Hospital, Hancock General and Hancock Medical Center lie directly in the flood zone. Ocean Springs, Gulfport Memorial or Sand Hill Hosptials may be better positioned to remain in operation. In addition, most coastal churches will be impacted by the storm surge so shelters should be opened in the northern portions of the counties.

Travelers in Hancock County along US 10 will find impassable flooded roads therefore highway ramps have also been included in the map to assist EOC with rescue efforts.A small portion of western and northern county road 607 should remain passable for emergency vehicles. Similiarly, only the western portions of US 10 and CR 90 will be passable in Jackson county.

06.02.10 Deliverable #2 and 3

The Mississippi Coastal Counties Hurricane Katrina Flood Water Extent Map was made for the University of West Florida's Applications in GIS class project for Unit 3: Hurricane Analysis. Students are required to present a layout view map showing elevation, hydrography, and Bathymetry of the Mississippi Coast counties with places, types of water, barrier islands, and hydrography. We were then required to submit a graph detailing flooded areas by land cover type.

Taking our map one step further we added the US Geological Survey land cover map and reclassified land cover types into 7 catagories.

Problem:

The catagories listed in Step 5 substep 4: 0 not flooded; 1 water; 2 barren; 3 developed; 4 forest; 5 agriculture; 6 wetlands; DO NOT MATCH the catagories provided in previous step 3 reclassifity land cover substep 3. As a result, I think the map is an inaccurate assessment of flooded lands. Given I followed the instructions precicely and I do not have the time to fix the error, I am moving on.


31 May 2010

06.02.10 Deliverable #1

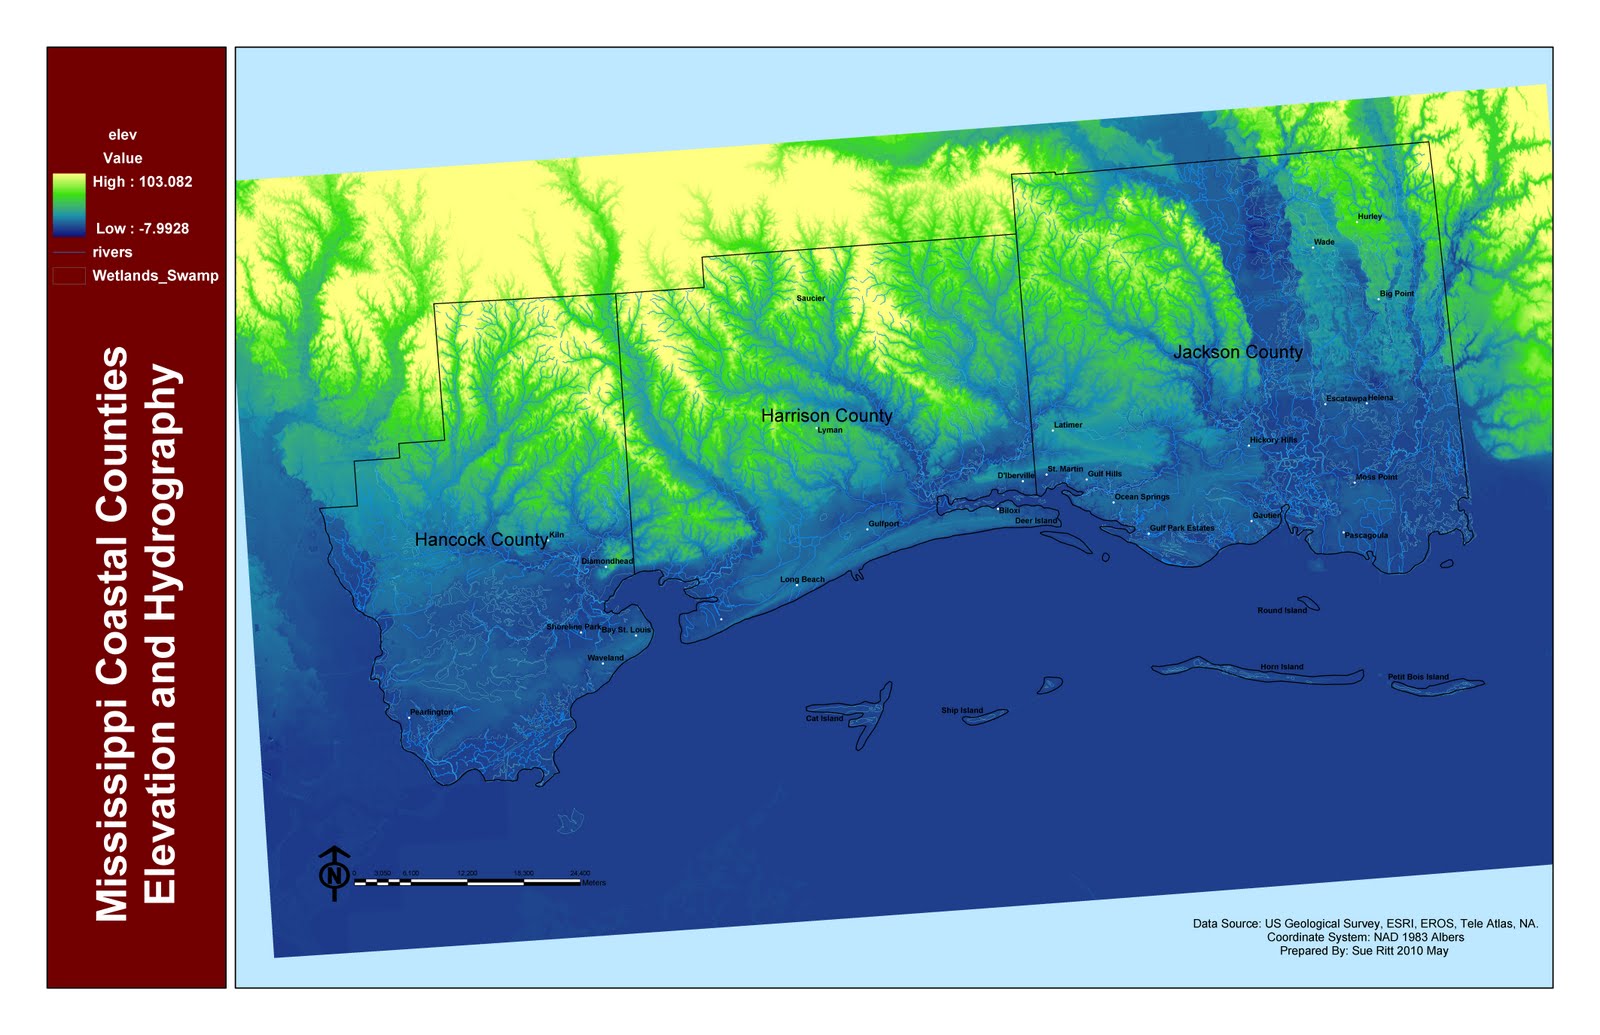
The Mississippi Coastal Counties Elevation and Hydrography Map was made for the University of West Florida's Applications in GIS class project for Unit 3: Hurricane Analysis. Students are required to present a layout view map showing elevation, hydrography, and Bathymetry of the Mississippi Coast counties with places, types of water, barrier islands, and hydrography.

The area's high ground tops outs at 103 meters or 338 feet above sea level. Unfortunately, a small percentage of the coastal counties of Hancock, Harrison and Jackson, Mississippi sit at this elevation. Instead, elevations up to almost 8 meters or 26 feet below sea level dominate. As is common along all of the United States shorelines, densly populated communities are found in these low-lying areas. Also present is a vast hydrographic system with thousands of creeks, rivers and swamps.

Problems:

1. Following this Step:
12. Add water and symbolize it with Unique Values using the FTYPE field. For the sake of time, remove all values except Swamp/Marsh and symbolize with a distinct color or symbol. To remove values, right‐click on the type under .

I was not able to remove the values as indicated in this step. I'm not following how to right click and remove the value. Instead I created a new shape file of the wetlands and swamps using select by attribute.

2. The slanted raster image AND slanted map. I do not undersand how I would crop this so that the pic is a square rather than slanted. I tried cropping it, I tried changing scale and also tried to enable the clip image in data frame properties.


As usual feedback and suggestions are greatly appreciated! Thanks! Sue