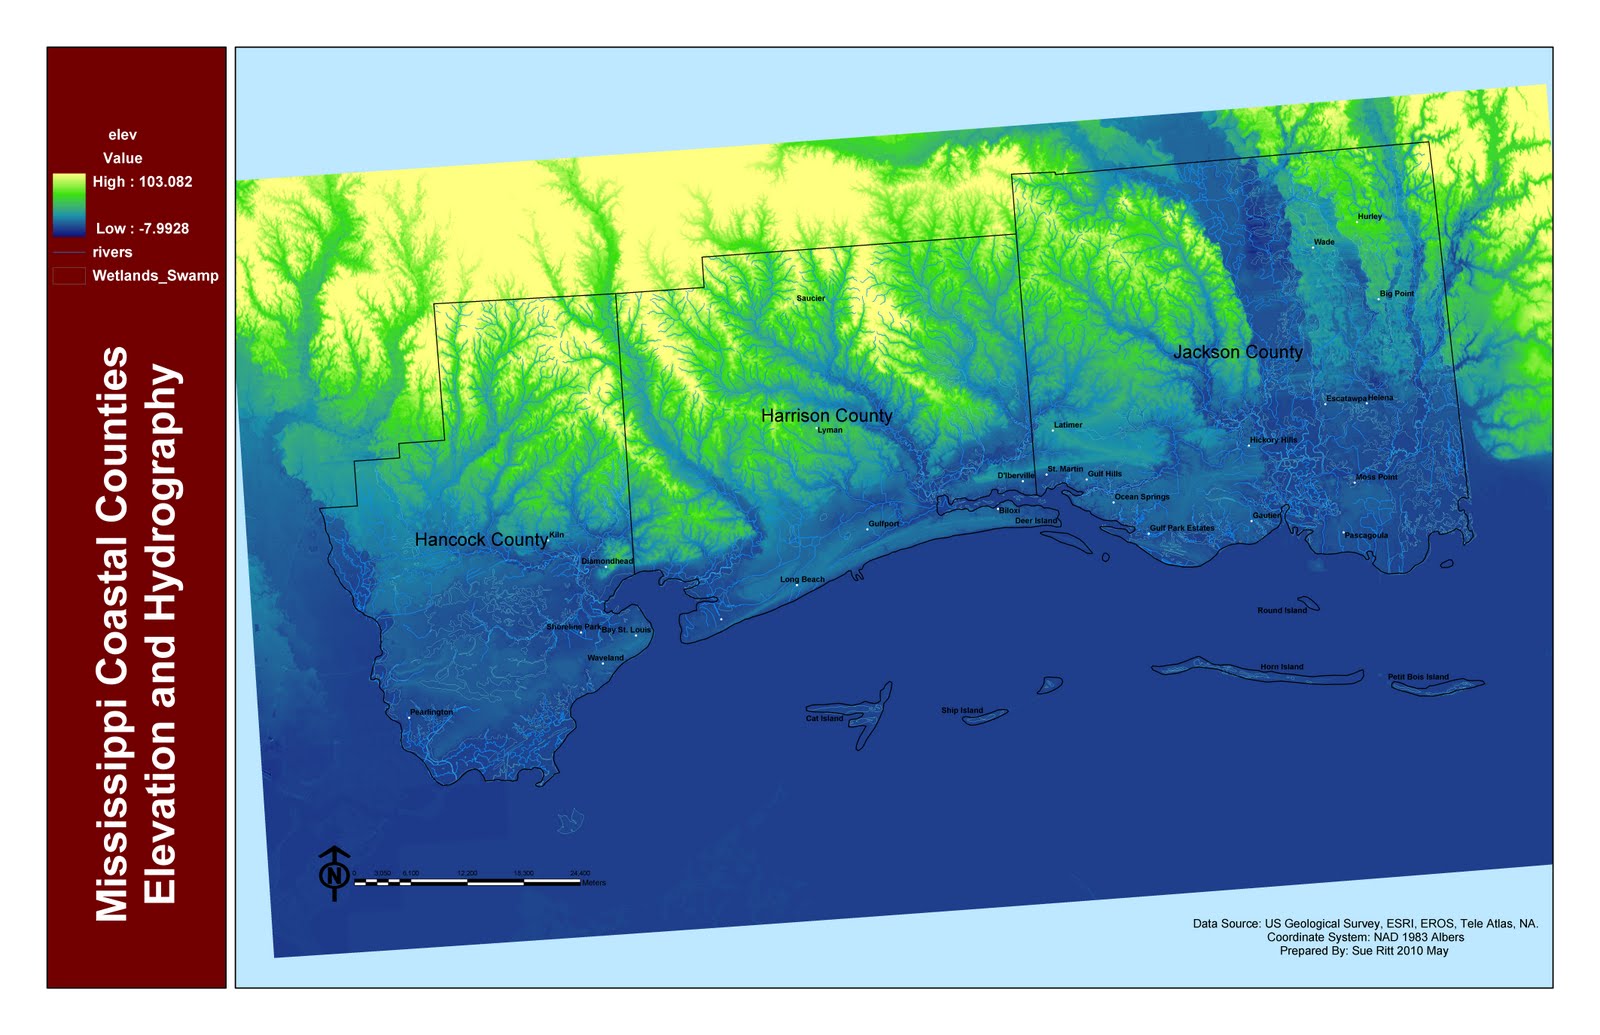
The area's high ground tops outs at 103 meters or 338 feet above sea level. Unfortunately, a small percentage of the coastal counties of Hancock, Harrison and Jackson, Mississippi sit at this elevation. Instead, elevations up to almost 8 meters or 26 feet below sea level dominate. As is common along all of the United States shorelines, densly populated communities are found in these low-lying areas. Also present is a vast hydrographic system with thousands of creeks, rivers and swamps.
Problems:
1. Following this Step:
12. Add water and symbolize it with Unique Values using the FTYPE field. For the sake of time, remove all values except Swamp/Marsh and symbolize with a distinct color or symbol. To remove values, right‐click on the type under
I was not able to remove the values as indicated in this step. I'm not following how to right click and remove the value. Instead I created a new shape file of the wetlands and swamps using select by attribute.
2. The slanted raster image AND slanted map. I do not undersand how I would crop this so that the pic is a square rather than slanted. I tried cropping it, I tried changing scale and also tried to enable the clip image in data frame properties.
As usual feedback and suggestions are greatly appreciated! Thanks! Sue